On the first week of June, students in our UAS course from the international Master of Science in Geospatial Technologies program went out to the field to collect data on a small river stemming from the Lake Aasee to begin the analysis on its renaturation process. The teams that took part in the field collection were Sensor and Platform, SenseBox, Image Analysis, and Project Management.
The Sensor and Platform team designed and 3D printed a mount for the Micro Drone md4-1000 gimbal that made it possible to hold both the Sony RGB and Mapir CNIR cameras. They planned a mission at 60m and simultaneous collected two types of data that would have typically taken an additional flight. While half the team prepped the drone and manned the ground control station (GCS) for the flight, the other team members placed ground control points (GCP) across the study area and collected ground truthing samples with the help of the Image Analysis team and GNSS/GPS survey equipment.
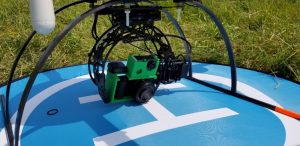
3D printed mount for both cameras
The SenseBox team utilized SenseBox devices to develop two sensors, one to collect humidity and temperature and another for collecting PM2.5 particle data. They attached the sensors to a platform below the drone with their own special modification. The propeller wash from the drone had potential to disturb the accuracy of the sensor readings so the team attached a combination of carbon fiber and plastic tubing to the sensors to expand their reach beyond the propellers.
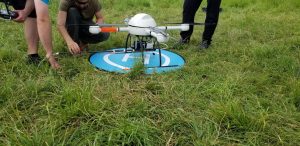
Microdrones md4-1000 with SenseBox and modifications mounted below
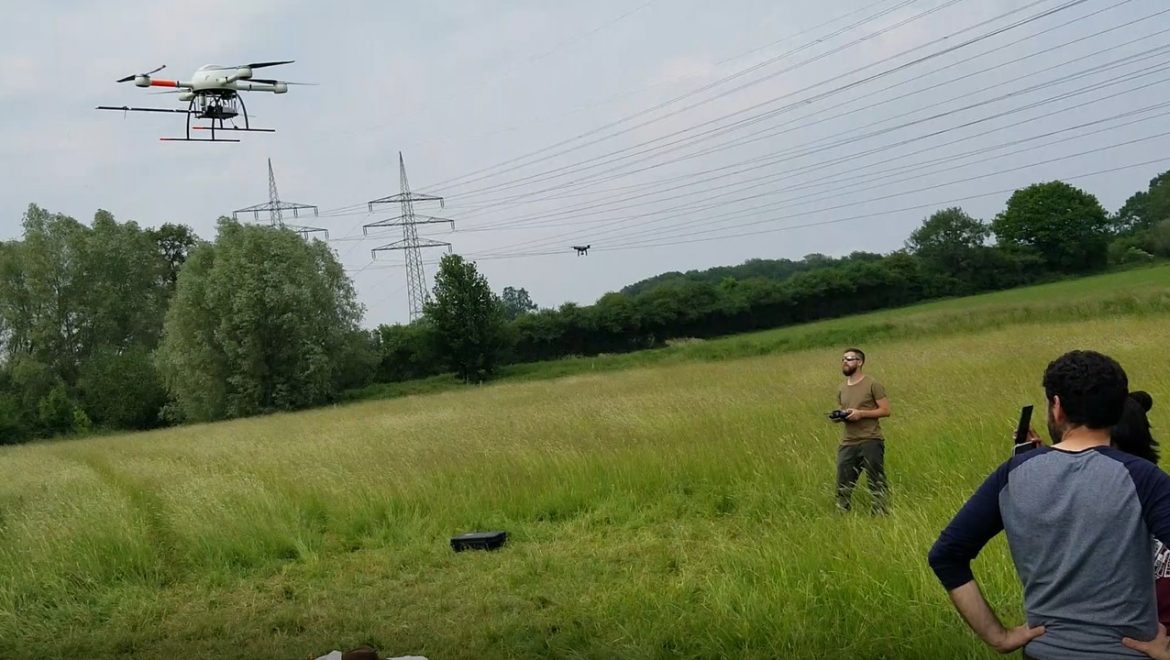
They flew the drone on a horizontal flight path at 60 meters across the study area and would stop at predetermined locations for 10 seconds to collect the SenseBox data. These same locations were replicated and collected on the ground so that an analysis could be made on how the data differs at various elevations throughout the study area.

md4-1000 taken off for the SenseBox mission
The teams in the field handed off the data to the Image Analysis team where orthomosaics, digital elevation models (DEM), point clouds, NDVI, classification, and interpolations maps will be made and compared to last years data to analyze the renaturation process. The Automated Workflow team is working on ways to automate the processes used from this project and the Web Portal and ESRI Cloud teams are working with unique ways to access and visualize the results. All teams will be presenting their work and results to the public on the 9th of July.